SEMA News—October 2015
RESEARCH
By Steve Campbell
2015 SEMA Market Report
New Features Reveal Consumer Buying Habits
 The 2015 SEMA Market Report is now available for free download by SEMA members at www.SEMA.org/automotive-aftermarket-research. It uses a combination of historical data, a new consumer survey and other reference tools to provide member companies with comprehensive information they can use to help their businesses. | |
Each year, SEMA’s research department produces a report that explores the automotive specialty-equipment market. The report examines the size of the market while also looking at different product segments, vehicle niches and sales trends. For more than 20 years, the report has been compiled based on data culled from industry manufacturers, providing an outward view of what their businesses are selling. For the first time, the research team has now added an element based on consumer feedback. The goal of the 2015 SEMA Market Report (available free to association members at www.sema.org/automotive-aftermarket-research) is to provide member companies with comprehensive information they can use to help their businesses.
“The starting point for our market numbers is the parts that get sold through distributors and the amount of revenue made from them,” said Gavin Knapp, director of SEMA market research. “We show not just the types of parts or the niches they get sold into but also where these parts were sold within the market based on input from manufacturers.”
What had been missing, the research team found—particularly as the Internet changed the marketplace—was a clear picture of what was going on in the retail side: what customers were buying, how they were purchasing products and where they were shopping.
“Developing this new data set from the consumer standpoint allows us to get more specific and more granular about product groupings,” Knapp explained. “Instead of just being able to say that the whole market’s products are sold in specific types of places, we can now tell you which specific product categories are sold at which retail venues and in what proportions. That is the key to the new data.”
The new information comes from a survey of 20,000 consumers who are representative of the United States population. They were asked what kinds of cars they own and what parts and accessories they upgraded, modified or replaced, and the research also drills down to where they purchased the products.
 The report shows that each product segment improved in 2014, with handling products displaying a particularly strong increase of almost 12%. | |
“Keep in mind that both sides are estimates based on samples,” Knapp said. “Nowhere in our industry does every transaction get reported and aggregated. On each side, we have to take a sampling of information and then extrapolate that information to the whole population. The manufacturing data encompasses pretty much all of the specialty-equipment parts sales, including those for passenger cars and light trucks as well as some parts that go to things such as powersports and marine applications. Obviously, we’re not going after motorcycle parts directly, but these would be crossover parts that may play into those areas. We focused our new consumer data specifically on passenger vehicles alone—cars and trucks. So you have the manufacturers reporting their gross sales on the one side and consumers reporting how much they’ve spent on the other side.”
That crossover probably accounts for the discrepancy between sales reported by manufacturers and purchases reported by consumers. The historical industry sales figure charted in the report’s overview is $36.15 billion, while consumer market purchases come to $34.58 billion. (Readers should also understand that the numbers are based on the 2014 calendar year, so the 2015 report indicates market conditions at the beginning of 2015.)
Looking at the historical data first, the marketplace is trending upward nicely after the recession, with 8.2% overall growth from 2013 to 2014. Economic stability and the rising number of new-vehicle sales for the past several years has put the industry back on a growth trend, the report states, marking the fifth year of increased sales for the specialty-equipment market. And while manufacturers reported that all segments are improving, the wheel, tire and suspension segment made notable gains of 11.7% over the previous year.
“Some of that is driven by the return of disposable income as the economy strengthens,” Knapp said. “It also makes sense that truck owners are now spending more on those items that particularly affect their vehicles. If you look at our vehicle niches, you’ll see that street performance has maintained the greatest growth, but growth in the truck segment was also significant. Truck is also one of those categories where some traditional accessories have been co-opted by the automakers, so now pickups roll off the showroom floors already equipped with items such as sidesteps and bedliners, and the newly disposable income has shifted to other things such as wheels, tires and suspension.”
 According to retail information collected from consumers, the automotive specialty-equipment industry is presently valued at $34.6 billion. More than a third of the products are sold through auto parts chains, both by physical location and online. Independent specialty stores are next in volume at 12%, followed by dealerships at 9%. | |
The report also reveals consistently improved manufacturer sales across virtually every product category, from amplifiers and speakers to truck caps and bed covers. The lone exception in the 15-category field is video/entertainment/navigational systems, which have seen sales decreases in each of the last four years. Again, however, many of those items have become automaker or dealership add-ons, so consumers still want them but are buying them already installed on new vehicles.
Overall, however, each segment has been on an upward trend since 2009. Performance products (now $9.44 billion in sales) and wheels, tires and suspension ($13.10 billion) had maintained growth even through the recession years, but the accessory and appearance segment was severely affected by the recession and didn’t begin to recover until a few years ago. While it was once the dominant category, topping out at well over $20 billion in sales in 2006, it is now producing sales of about $13.61 billion.
“That comes back to the idea of disposable income as a big driver of that segment,” said Knapp. “In terms of our general economy in the early 2000s, everything was going great and everybody was spending big—sometimes credit spending, but spending big. When that discretionary income pulled back, it was largely felt in the accessory grouping. Those are the things that the general populace feels are nice to have rather than necessary, whereas a significant portion of our customer base feels the need to have performance-related products and will always do so even when the economy wavers.”
In fact, according to the report, the street-performance niche of the overall performance category continues as the largest of all SEMA niches, accounting for nearly $10 billion in retail sales. Street performance involves products that are used to modify the performance, appearance and handling of “performance vehicles” for street use, and it fuels much of the overall growth in the market, climbing more than 14% this year. (The category excludes light trucks and passenger cars that are not typically designed for performance.)
The off-road market, while considerably smaller at $1.7 billion in sales this year, reached its highest level in nearly a decade, the report shows. The off-road niche is distinctly separate from the light-truck niche and consists of products specifically designed for off-road use, even if they’re used only on-road. Unlike trucks, the off-road niche was less affected by the recession, with sales remaining steadily upward from 2001 on.
 While search engines are the primary source for information on specialty-equipment parts, many consumers rely on advice from friends and family and also research retail websites. More than a third of accessorizers visit stores/dealerships or parts manufacturer websites. | |
The report’s shift from manufacturer data to consumer market data opens with a look at a graph based on purchases classified by sales channel. It is striking that auto-parts chains—both online and fixed locations—are still the mainstay where people buy automotive
specialty equipment.
“While our industry tends to think about enthusiasts as our market, our researchers found that the enthusiast group may make up only half of our customers in any year,” Knapp said. “We have to remember that there is a broader market out there, and specialty equipment is a broad market to begin with. Not everything consists of going into a speed shop and getting a part.”
The next chart on consumer purchases by vehicle segment shows that midrange and traditional cars and pickups are the sales leaders, with SUV not too far behind. One of the oncoming classifications is crossover utility vehicles (CUVs), which now account for 10% of purchases by vehicle type.
That graph is followed by detailed information about consumer-reported purchase estimates broken out in the three product categories: accessory and appearance products ($15.72 billion), performance products ($8.95 billion) and wheels, tires and suspension ($10.13 billion). The data from the three main segments is broken into subcategory purchase estimates (for instance, drivetrain, engine, safety, etc. under performance products), and then into purchase and percentage-of-driver estimates for specific products under each subcategory.
The consumer section covers 43 product categories. In addition to the information above, a list of sales channels for each individual category shows where they were purchased and what types of vehicles they were installed on (each by percentage).
“As you go through this section, you see how things differ,” Knapp said. “For instance, the majority of purchases of wax and cleaning products are made at auto-parts chains and retail chains. But if we look at truck caps, we see a shift to independent specialty stores and even car or truck shows. When we look under performance special-purpose tires, the auto-parts chains still maintain the greatest portion of the market, but independent specialty stores are almost equal. When a lot of people go for specific products, they go where they believe the products are best known.”
Which brings up an interesting point, Knapp said.
“In some cases, people order tires on a website and then come into a physical store to have them installed,” he pointed out. “When should that type of sale be tallied as an online purchase rather than a brick-and-mortar purchase? These are some of the things that we will try to shake out over time. Year-over-year examinations of these types of things are going to improve the quality of the data.”
 The Ford F-Series and Chevrolet Silverado remain the two top-selling vehicles in the United States. The vehicle in the top 30 that experienced the most growth this year was the newly released ’14 Jeep Cherokee. | |
In addition to the product sales and purchase data, the 2015 SEMA Market Report also includes consumer profile information, such as where retail customers go to research parts purchases, whether parts are installed by the purchaser or by someone else and breakdowns of purchase amounts based on vehicle type as well as more traditional demographic information.
“When you look at where people are doing their research, it’s probably not a big shock that they’re going online,” Knapp said, “but it’s also nice to still see word-of-mouth up there as well. At least people still talk to people. We also know that some people shop in stores and go online to buy, while others do the opposite—go to an online retail website, see more options, learn about things without feeling any pressure, and then go into the store to make the purchase. And when people say that they are looking at parts manufacturer websites, that’s pretty powerful.”
It’s instructive to note that 40% of consumers look at retail websites for information, so retailers can gather plenty of insight from the report. Obviously, people will still come into a brick-and-mortar store off the street to shop, but it is a helpful adjunct to have a website for a store to help drive business.
“Looking at the age data, we also found that young people are actually more likely to be accessorizers than older people,” Knapp said. “In some ways, that goes against the popular media line that young people don’t care about cars. But this is fun stuff, and young people like the personalization aspect, customization and even performance. When we look across different age groups, younger people are more likely to be accessorizers than people over 40. And when you look at the age sales by channels, it’s almost exactly what you would expect: Almost 70% of the people who buy under 40 are buying online, and only 5% of older people buy online.”
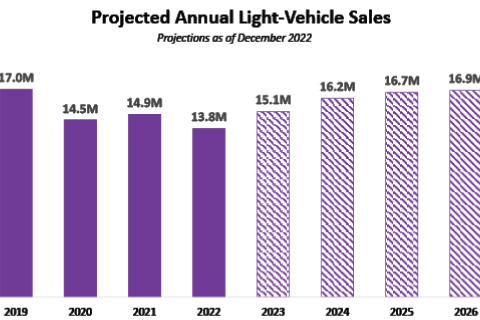
The next section of the report covers industry indicators and national economic trends, and the first graph in that section compares gross domestic product (GDP) to specialty-equipment sales and new-vehicle sales. While each category of the graph generally follows the others, it shows auto sales making the biggest drop of the three during the recession and the largest correction in the past few years, which continues to bode well for the automotive aftermarket.
“Another thing that affects our industry a lot is the changes in the new-vehicle mix,” Knapp said. “The types of new vehicles that are popular and selling fluctuate from year to year, so we also included that type of information in the report. Our members need to follow those changes and be able to have products for the different types of vehicles. Specialty equipment can go on any vehicle, of course, anything from the classics to the brand new, but having more vehicles available to the industry is always a good thing.”
Information about the market and how product trends and segment trends fit with that market isn’t just a blur of data. Understanding where consumers go for research and shopping may allow manufacturers and retailers alike to most effectively adjust their product mix as well as their marketing and advertising. The 2015 SEMA Market Report can truly help you target your customers.