SEMA News—September 2013
RESEARCH
By Steve Campbell
2013 SEMA Annual Market Study Preview
Current Report Details Slow But Steady Industry Improvement
 Things are looking up. That’s the overall impression cast by the just-released 2013 SEMA Annual Market Report. The new study provides a composite view of the automotive specialty-equipment industry and new-vehicle sales, and is packed with information and background that businesspeople from all market segments will want to access. The study is available now and can be downloaded here.
The report’s major findings include a return of growth for the industry overall. The street-performance niche continues to drive the rebound with a 15.3% year-over-year increase, but the light-truck niche also experienced the first growth in four years with a 1% increase in sales. The appearance and accessories segments are growing based largely on mobile electronics, even though interior and exterior appearance accessories sales continue to lag. And overall industry sales climbed 4.4% from 2011 to 2012 to reach $31.32 billion. That is an increase of more than $3 billion from the low point in 2009 during the Great Recession.
“The specialty-equipment market includes parts and accessories that are manufactured, sold and distributed for cars, light trucks and other passenger vehicles (motorcycles, ATVs, UTVs, boats, etc.),” the report says. “These products are designed to customize or enhance the performance, handling or appearance of new or used vehicles. The market does not, however, include direct repair or replacement parts intended to replicate factory specs (except in the case of restoration parts for older vehicles). The specialty-equipment market is often described as the parts you want rather than those you need. Some examples of products that fall into the specialty-equipment market include exhaust kits, suspension kits, custom wheels, stereo systems and engine modifications to increase horsepower.”
The report tracks two broad types of sub-groups within the automotive specialty-equipment market: three product segments and nine market niches. Product segments are groups of products that serve similar functions and are generally added for comparable purposes. The three segments defined by SEMA include accessory and appearance products; performance products; and wheels, tires and suspension. Vehicle types, how they are used and applicable components define the market niches, each of which may be outfitted with products from the three product segments. The nine niches defined by SEMA are:
- Street Performance
- Compact Performance
 Light Truck
 - Restyling
- Restoration
- Off-Road
- Street Rod and Custom
- Racing
- Other
In some cases, inclusion in a niche may require a determination of the nature of the vehicle’s use. For instance, light trucks outfitted for the street and those used in off-road settings serve different purposes, so product design and use may determine which category a given vehicle is assigned to. Establishing the definitions may also involve how specific products are used and where they are sold. For example, products designed for the trail—even if they are used on-road—are designated as being part of the off-road market. To clarify the definitions, the report details the criteria and types of vehicles that are assigned to each niche as well as how the wide varieties of components are grouped into the segments.
| |

As noted, the news is positive in virtually every segment and niche, with total sales increasing to well over $31 billion for the industry as a whole. The percentage of product sales increases ranges from 2.7% for wheels, tires and suspension and 4.9% for accessory and appearance products to 5.7% for performance products. The niches likewise show increases across the board, with the street-performance niche showing the greatest gains at a 15.3% sales increase during the reporting period. Even the street rod and custom niche improved 5.2% year over year (and, it should be noted, was one of the few niches in the industry that maintained relatively steady sales throughout the recession).
The report breaks out sales data in a variety of ways, allowing businesspeople to look at sales of specific product groupings within the segments over the course of a six-year period as well as the volume share of various outlets within the distribution channels. It provides details of where consumers most often make purchases not only in the overall marketplace, but also with detailed analyses of consumer purchase patterns within each niche.
The report also provides detailed data about where consumers do their pre-shopping research. Not surprisingly, the Internet is an increasingly popular venue for product searches, while chain auto parts stores are the number-one location for actual purchases for most buyers.
| |

The increases in the sales of street-performance products run the gamut, with all three product segments showing nearly identical growth curves. Street performance by itself accounts for more than $7 billion of the industry’s total sales. Meanwhile, the compact-performance niche—which includes domestic as well as imported small vehicles—also posted gains year over year. The category boasted $5.04 billion in total sales, with the lion’s share coming from accessory and appearance products.
The report shows that the accessory and appearance product segment took the greatest hit in the light-truck niche. While product sales in all three segments declined, the accessory and appearance graph most closely mirrors the niche’s overall losses during the recession. The niche was hit with a double whammy when gas and diesel prices escalated during the past few years, further decimating what may be the niche most sensitive to fuel concerns.
The good news as the recovery takes hold is that new light-truck sales continued the upward trend that began in 2010. The report points out that the Ford F-Series is still the top-selling vehicle, followed by the Chevrolet Silverado.
The off-road niche, which is also composed of mainly light trucks, weathered the recession far better. Its overall sales aren’t nearly on par with those of the light-truck niche, but it maintained good sales in its major product segment, wheels, tires and suspension, and is now back to sales levels comparable to those just prior to the beginning of the economic downturn.
| |
|


The restoration numbers tabulated in the report also show improvement, and while the niche hasn’t reached pre-recession levels due to accessory and appearance product sales declines, its sales in the other two segments have strengthened. The somewhat related street rod and custom niche, on the other hand, has shown steady incremental growth throughout the 12-year period that is reviewed in the niche sections of the report. The hobbyists who inhabit this niche have traditionally been older and more established, and their resources may not have been depleted to the same degree as those of other consumers.
The report also shows the racing niche rebounding after a slight decline in 2011. In fact, it is at its highest sales level in the entire period covered by the report. Not surprisingly, performance products far outstrip accessory and appearance parts in
that category.
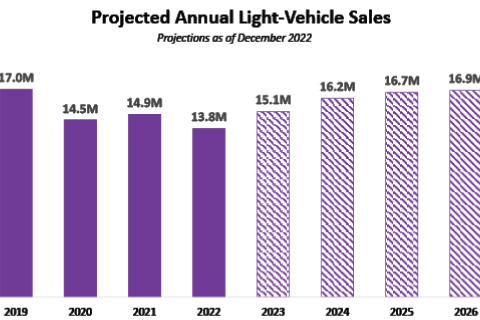
The update on the first quarter of 2013 continues the upbeat news. That section of the 2013 SEMA Annual Market Report shows the third consecutive increase in new-vehicle sales, up 13% over the previous year, and it shows the automotive specialty-equipment industry outstripping overall gross domestic product increases.
“Unemployment continues to be a sore spot for the economy,” the report says, “though the rate has steadily decreased from the 2009 high. The unemployment rates in the United States have been declining overall the past few years and are forecast to continue to decline steadily through the next several years. Though the rate isn’t expected to quickly drop back to 2007 levels, economists are becoming more optimistic about improvements.”
The report points out that both income and consumption suffered big drops in 2009 but says that current figures seem to indicate that consumers are anticipating further improvements. One positive indicator is that the SEMA Show has experienced steady growth since 2009. “In 2012, the SEMA Show had its highest attendance ever,” the report says, “and 2013 is estimated to be even bigger.”
The update section contains further details from the SEMA Show regarding the New Products Showcase (which tallied a total of 1,929 unique entries in 2012) as well as information about the most recent Consumer Demand Index and the SEMA Financial Benchmarking Program. Those indicators are designed to provide SEMA members with comparative data about consumer buying intentions and comparisons between business operations.
| |

The report shows that total car sales in 2012 increased about 18.9% compared with the previous year, while light-truck sales increased 8%. But there were declines in the sales of larger vehicles, including cars, CUVs, SUVs as well as small CUVs and small pickups, while midsize cars and luxury CUVs experienced the greatest growth in 2012 at 23.5% and 22.5% respectively.
SEMA conducts research on the automotive specialty-equipment market as a benefit to its members. Such projects are designed to help members understand sales trends, consumer needs and the influence of economic and auto industry changes. The majority of SEMA market research reports are available for download to SEMA members at without charge.
SEMA’s market research department compiled this report using a multitude of sources. Telephone interviews, mailed questionnaires, Internet questionnaires and parallel research was conducted by Lang Marketing Resources, and the SEMA team mined the association’s consumer segmentation study to determine the buying habits of 3,000 specialty-equipment product buyers who each spent more than $100 per year on automotive accessories and modifications. Additional information on new-vehicle sales was collected from the Ward’s Auto website, and Experian provided information about vehicles registrations through the 2012 calendar year. In addition, the U.S. Census Bureau, the Federal Reserve, the Bureau of Economic Analysis and the U.S. Energy Information Administration provided data on national economic trends.
“Think of the 2013 SEMA Annual Market Report as a starting point for the information that SEMA can provide to help your business,” said Gavin Knapp, senior manager of market research for the association. “We encourage you to take advantage of its findings as well as all of the research reports available on the SEMA website, www.sema.org/research.”