SEMA News—June 2012
RESEARCH
By Steve Campbell
2012 SEMA Annual Market Report Preview
New Report Points to Improving Sales
 The 2012 SEMA Annual Market Report has just been released and is now available. |
|
The 2012 report provides an overview of the automotive specialty-equipment industry as it stood at the end of 2011. It was assembled using data collected by Lang Marketing Resources Inc. through interviews with manufacturers, wholesalers and retailers as well as consumer surveys and government data. Specific sources in addition to Lang included Ward’s Auto and Experian.
Of special note in the 2012 version of the report is a change in the way the compact performance and street performance niches are described and viewed. The data in these two niches had become muddled over the years as some midsize vehicles and sports cars had been included in the compact performance reporting. This year, the data in those two areas has been restated so that the compact performance niche no longer includes larger vehicles or those with engines utilizing more than six cylinders, and sports cars have also been excluded. Instead, those vehicles are now included in the data for the street performance niche.
“Using 2006 as a baseline year, approximately 23% of the compact performance niche shifted to the street performance niche, reducing the 2006 compact performance niche from $2.099 billion to $1.612 billion,” said Jim Lang, president of Lang Marketing Resources. “Conversely, the 2006 street performance niche increased from $0.717 billion to $1.204 billion. There was no change in the combined size of both niches.”
The restatement throughout the following years details similar changes, with the corrected compact performance niche significantly reduced and the street performance niche increased to a corresponding degree. In fact, the 2012 report shows the street performance niche to be the largest of the eight primary niches in the industry.
Throughout the report, data is presented using three broad product segments and nine market niches. The product segments include appearance and accessory products; performance products; and wheels, tires, and suspension. The nine niches are based on vehicle type, how the vehicle is used, the type of components involved and the application and use of the products. The niches include light truck, off-road, racing, compact performance, street performance, restyling, restoration, custom and other. Of the three product segments, accessory and appearance products remains the largest in terms of total sales, though drops in 2008 and 2009 have nearly evened out sales among the segments.
 The specialty-equipment market continued its rebound in 2011, with a 5% increase compared to 2010, marking a second year of improvements that had been preceded by two years of sharp decline. |
|
“Strong sales of new vehicles and general improvements in the economy, leading to increased spending among consumers, bode well for continued growth in the specialty-equipment market,” the report says.
In providing details and graphic data presentations, the report combines four major types of information to determine the size of each of the eight specialty-equipment markets (excluding “other”): product information, vehicle information, distributor/retailer/installer information and parallel research.
Niche Observations

Most accessory buyers who took part in SEMA’s Consumer Segmentation research reported visiting automotive-related websites and used Internet search engines in researching parts purchases. Even so, most consumers reported making their final purchases at automotive chains, even though they did their research online.
|
|
“Light-truck accessory sales plummeted from their peak in 2007 but seem to have begun to level out,” the report says. “The drop from 2010 was 6.5%, compared to 14% the previous year.”
As a result of the changes mentioned earlier in the way the niches are evaluated, the street performance niche has become the new leader in retail sales.
The restated compact performance sales from 2006 forward shows that this niche has leveled off during that period, but it continues to be supported by younger buyers who are interested in increasing the performance of their vehicles.
While the truck and off-road niches show higher upgrade rates in suspension and handling products, the compact performance and restyling niches still sell more appearance and accessory products. Even with the restated numbers from 2006 forward, the compact performance niche grew slightly, but the off-road niche still experienced a slight decline in 2011, when overall retail sales dropped 4%.
Sales in the street performance niche continued to increase in 2011 and, with the increased numbers coming over from the compact performance niche as a result of the reporting changes, it is now the leading niche and showed 14% growth for the second consecutive year.
The restyling niche, which mainly consists of appearance accessories sales, also showed growth for the second consecutive year, posting gains that brought it to a mere 2% below where it was in 2007 prior to the recession.
The restoration niche likewise showed promise. It had fallen from a peak of $1.49 billion in sales during 2007 to a trough of $1.37 billion in 2009. By 2011, however, sales had rebounded to $1.43 billion, slightly better than in 2006.
As with the other niches, retail sales in the street rod and custom niche suffered with the faltering economy after 2006, but the category has maintained incremental growth throughout the period since and currently sits at its highest recorded level. The racing niche also showed growth from 2006 on, though it did post a slight overall decline during the past year because of flagging accessory sales, despite the fact that sales of performance parts, wheels, tires and suspension products increased in the category.
Trends
 Accessory and appearance products represented more than half of specialty-equipment market sales through most of the last decade, until the steep decline in 2008 and 2009. The three segments are now closer in their overall share of the market. |
|
 Sales for light-truck specialty-equipment products have not yet rebounded, even though vehicle sales are up. With a reevaluation of the compact performance and street performance sales after the last market report, the new leader in retail sales is the street performance niche. |
|
 With the restated values going back to 2006, the street performance niche now sits at the top of the specialty-equipment market in terms of total retail sales and experienced a second consecutive year of 14% growth. The eight major enthusiast niches are covered within the 2012 market report. |
|
The 2012 SEMA Annual Market Report also looks at historical and trend information concerning consumers’ buying habits, vehicle sales and the overall economy. It draws in part upon an upcoming report—the 2012 SEMA Consumer Segmentation. For instance, when consumers were asked where they find information about upcoming purchases, most of them reported visiting automotive-related websites and performing Internet searches.
Conversely, however, the data indicates that consumers still make most final purchases at automotive chains, even though they do their research online.
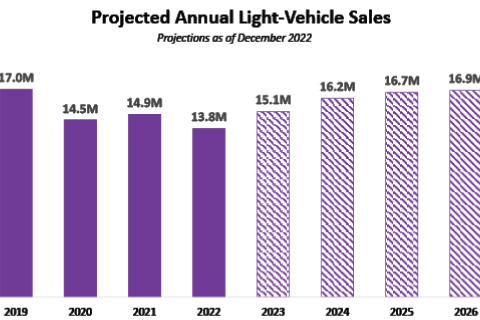
The report offers positive trends for both the overall automotive industry and the economy in general. The U.S. gross domestic product grew each quarter of 2011, and the reported data show that the industry continues to recover, with increases in vehicle sales of nearly 11% for 2011. And while the light-truck niche is no longer the top category for the automotive specialty-equipment industry, the two top-selling vehicles in the United States continue to be pickup models.
The SEMA Show provides another positive indicator, with attendance increases over the past two years and optimism reported among buyers and exhibitors.
The 2011 Show was the best-attended ever, and registrations for the 2012 event are running at a record pace.
SEMA’s Consumer Demand Index (CDI) and Financial Benchmarking programs also offer positive outlooks, according to the market report.
The CDI is designed to track and help forecast consumer demand for automotive products in all three product segments noted above. An index chart included in the report shows an overall increase in demand for the year, with a particularly strong jump in September, declines in October and November, and another jump in December to finish the year.
The Financial Benchmarking data reviews specific performance indicators to compare SEMA-member business operations with those of other companies in the industry.
The program provides assessments of year-to-date sales, shipping costs and advertising costs among manufacturers, distributors and retailers through anonymous questionnaires that are distributed and tabulated by Hedges & Company.
The distributors and manufacturers that participated in the Financial Benchmarking program in 2011 indicated improved sales over 2010 for each month. Retailers also provided positive sales assessments, with July being the only month in which flat sales were more prevalent than increases.
New-Vehicle Sales
The 2012 SEMA Annual Market Report concludes with comprehensive comparison charts of new-vehicle sales from 2007 through 2011. The first section looks at the top 30 best-selling vehicles of 2011, with a percentage-of-change column that shows the ratio of increase or decrease from 2010 to 2011. That is followed by full market charts that are segregated by cars, CUVs, SUVs, vans and pickups, each of which is further subdivided by category, such as small, midsize, large and luxury.
 Among the information presented in the 2012 SEMA Annual Market Report are charts that detail what products are purchased within the various enthusiast niches. This chart is from the section on light trucks. |
|
The chart for the overall market shows an 8% increase in total car sales for 2011 over 2010, and light-truck sales increased 13% during the same period. Unlike the top 30 sellers, the overall chart seems to reflect the increase in fuel prices, with declines in the sales of large cars and luxury SUVs and increases in small CUVs and midsize SUVs.
One of the most encouraging takeaways from the 2012 SEMA Annual Market Report is the fact that the automotive specialty-equipment industry was back to the $30 billion plateau in total sales for 2011.
The information contained in the report offers terrific insights into the market for every professional in the industry.
“We would like SEMA members to think of the report as a starting point for the information that the association can provide to help their businesses,” said Gavin Knapp, SEMA’s senior manager for market research. “We encourage them to take advantage of all the research reports available on our website, www.SEMA.org.”

In addition to other forms of research, the market study also looks at the marketplace from the perspective of SEMA’s Consumer Demand Index, which finished six points higher during 2011.
|
|
 The final section of the 2012 SEMA Annual Market Report is devoted to a comprehensive look at new-vehicle sales, including this chart that shows the percentage of sales change for the top 30 vehicles sold during 2011. |